The short version
Before You Buy Guide keeps an estimated price range for every product it recommends and re-checks those ranges every week. At our latest price check, on 5 October 2026, that dataset held 693 published price ranges across 147 buying guides, in 12 departments. As in August, that counts one range per guide entry, so a product covered in two guides appears twice and the two editions compare directly. This is the second edition of our monthly report, and the first that can say what changed.
693 published price ranges across 147 published guides, in 12 departments. In August it was 507 ranges across 102 guides, in 11 departments.
Median price: $70 to $100. That is the midpoint of the low ends and the midpoint of the high ends across all 693 ranges. It’s the working price band of the median product we recommend, not a single average. In August it was $85 to $110.
102 of the 693 ranges start under $25, and 262 under $50. That is about 38% of everything published, up from 66 and 179 (roughly a third) in August.
By department
The three largest departments by product count are Gifts (96), Health & Wellness (91) and Home & Kitchen (84). In August they were Home & Kitchen, Beauty and Gifts. Dark bar: the median entry price to the median top pick. Grey line: the full range listed. Log scale.
The widest ranges
 GamingAlienware Aurora R16$1,500–2,300spread $800
- GamingMSI Aegis$1,500–2,200spread $700
- OfficeSteelcase Leap$1,400–2,025spread $625
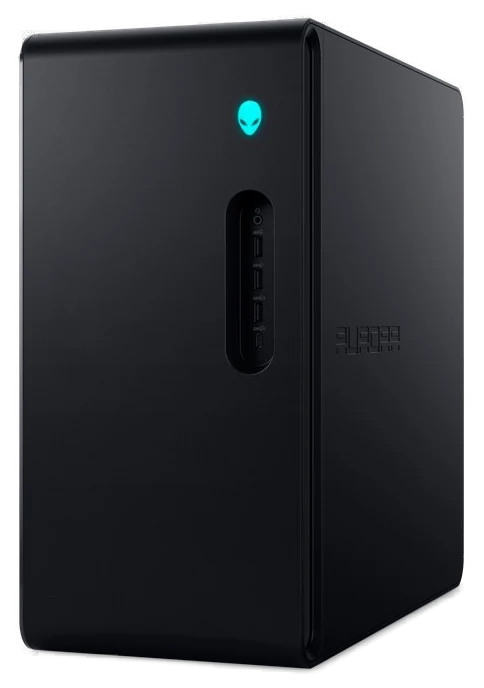

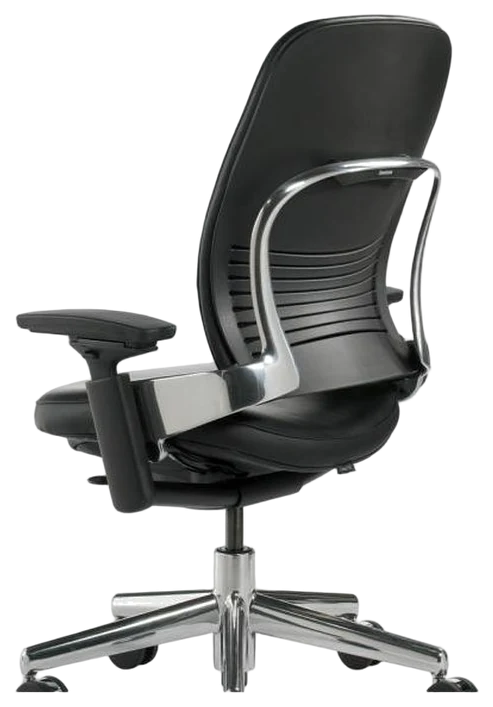
The widest individual price ranges belong to the Alienware Aurora R16 ($1,500–2,300), the MSI Aegis ($1,500–2,200) and the Steelcase Leap ($1,400–2,025). The Herman Miller Sayl left the top three when we corrected its range to $935–1,275 on 7 October.
What changed since August
The dataset grew by 45 pages and one department, and the median fell because the new pages sit lower. Prices didn’t drop across the board. The ranges on the pages we already had barely moved as a group; the new pages pulled the middle down.
All 102 of August’s pages are still published. The 45 new to the count are 24 buying guides and gift lineups and 21 head-to-heads. Thirty-three were first published on 14 September, including the 12 that opened a new department, Clothing & Accessories. Most of the 11 new Health & Wellness pages cover supplements, first aid and home health monitors. Six of the eight new gift lineups cap their picks at $50 or less.
The new pages add 187 ranges. One guide lost a range: gaming PCs under $1,000 went from three picks to two on 27 September.
The new pages explain the lower median. August’s 102 pages have a median of $80 to $110 today, close to their $85 to $110 in August. The 45 new pages have a median of $50 to $65. They also hold most of the growth under $50: 87 of the 262, while August’s pages went from 179 to 175. Health & Wellness shows it most. Its median entry price was $130 in August and is $50 now, as supplement and first aid guides joined the gadgets and air purifiers it held before.
Within August’s pages, 474 of the 507 entries still name the same product in the same guide. Of those, 374 carry the same range as in August. The other 100 changed: 67 now sit lower, 31 higher, and 2 widened or narrowed around the same middle.
The remaining 33 entries now carry a different product or model name. Every guide that swapped a pick carries a dated note saying what changed. The largest round was the 23 September price check, which replaced discontinued, renamed and over-limit picks in 45 guides.
What this report is, and isn’t
This is the first edition with a month to compare against, and the comparison describes our dataset, not the market. A range in our guides changes for one of two reasons. Either the price at the retailer moved, or a re-check found our range was wrong and we corrected it. The figures above don’t separate the two, so we don’t read the 67 lower ranges as prices falling.
For you, the practical reading is simpler. If you’re weighing a pick against a figure in the August report, check the guide itself: each one shows the date its prices were last checked. Every correction that changed what a guide told you is logged with a date on our corrections page.
Methodology
Every figure in this report comes from the price range published in one of our own buying guides. The ranges are estimates, not quotes. Each is re-checked against current retailer listings in a weekly price check; the latest ran on 5 October 2026. When a number moves, the guide’s range is updated, and the price index is recomputed from the guides rather than maintained by hand.
This report counts one range per guide entry, as the August edition did, so the two compare like for like. The price index counts a different way, on purpose. It lists each product once per department with its most recently checked range, which comes to 572 ranges from the same guides. Both counts are correct; they answer different questions. The full methodology, its limits and how to cite this data are on the price index page. How the checking works, from the second-pass review to the weekly schedule, is documented on how we verify.
- The 693 price ranges published in our 147 buying guides on 5 October 2026 (one range per guide entry).
- The price index: the full breakdown, its methodology and its limits.
- How we verify: the recurring price sweep and the second-pass review.
- Corrections to these figures are logged on our corrections page.
Before You Buy Guide, “The BYB Price Index: September 2026 Report,” 5 October 2026, beforeyoubuyguide.com/the-byb-price-index-september-2026-report/
Journalists and researchers are welcome to cite these figures; no permission is needed, we ask for a link back so readers can see the method behind the number.
No. 2 · October 2026