The short version
Before You Buy Guide keeps an estimated price range for every product it recommends. As of today, that dataset holds 507 published price ranges across 102 buying guides, grouped into 11 departments. That counts one range per guide entry (a product covered in two guides appears twice), so the unique-product count is lower. This is the first edition of a report we plan to publish monthly, built from that same dataset: the full breakdown lives on the price index, and this is a dated snapshot of what it shows right now.
507 published price ranges across 102 published guides, in 11 departments.
Median price: $85 to $110. That is the midpoint of the low end and the midpoint of the high end across all 507 ranges — the working price band of the median product we recommend, not a single average.
66 of the 507 published ranges sit under $25, and 179 under $50 — roughly a third of everything published.
By department
The three largest departments by product count are Home & Kitchen (72), Beauty (52) and Gifts (49). Together they account for close to a third of the dataset. Blue: the median entry price to the median top pick. Grey line: the full range listed. Log scale.
The widest ranges
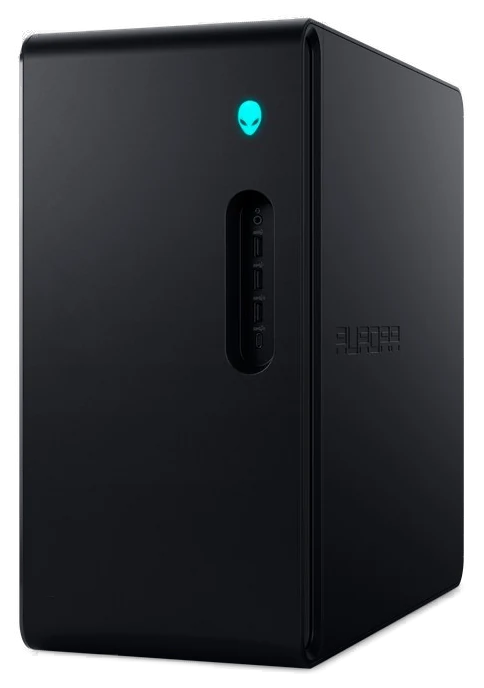 GamingAlienware Aurora$1,800–2,800spread $1,000
 GamingMSI Aegis$1,500–2,200spread $700
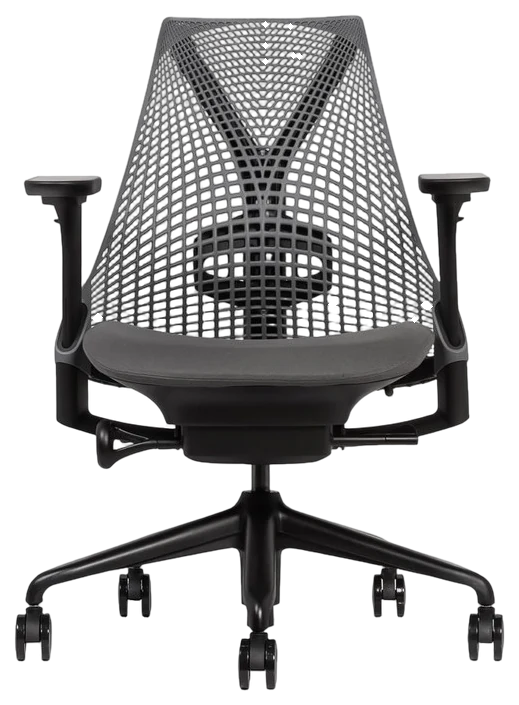 OfficeHerman Miller Sayl$885–1,530spread $645
The widest individual price ranges belong to the Alienware Aurora ($1,800–2,800), the MSI Aegis ($1,500–2,200) and the Herman Miller Sayl ($885–1,530). Ranges that wide are what a category looks like when sale pricing, configuration and model year all move the number at once.
What this report is, and isn’t
This is the first report in the series, so there is no prior month to compare it against and no month-over-month movement to report yet — the numbers above are a snapshot, not a trend. Once a second monthly edition exists, this report will start noting what moved between them and by how much. Until then, we are not going to guess at a trend line that doesn’t exist yet.
The dataset itself does move for a more mundane reason: it is re-verified continuously, not once a month. Guides get added, guides get re-swept, and the totals shift as a result. The correction logged on the price index this month (the corpus grew from 422 published ranges across 92 guides to the current 507 across 102) is a record of that process working, not a market movement.
Methodology
Every figure in this report comes from the price range published in one of our own buying guides. Those ranges are not scraped from a single retailer at one point in time: every price is re-verified against live retailer listings on a recurring sweep, the guide’s price bar is updated when the number moves, and the price index is recomputed directly from the guides themselves rather than maintained by hand. The full methodology, its limits, and how to cite this data are on the price index page. How the verification itself works (the second-pass review, the sweep schedule, and what it has caught) is documented on how we verify.
Sources and method
- The 507 price ranges published in our 102 buying guides on 9 August 2026 (one range per guide entry).
- The price index: the full breakdown, its methodology and its limits.
- How we verify: the recurring price sweep and the second-pass review.
- Corrections to these figures are logged on our corrections page.
Cite this report
Before You Buy Guide, “The BYB Price Index: August 2026 Report,” 9 August 2026, beforeyoubuyguide.com/the-byb-price-index-august-2026-report/
Journalists and researchers are welcome to cite these figures; no permission is needed, we ask for a link back so readers can see the method behind the number.